Reminder to Patients: This is a FEE-based marketplace, not a Donation-based one. Where you spend your dollars is, I’d imagine, a very personal decision. It is also an important one. It is one with consequence.
As of late this past week (13 days into the unified MoM (Market of the Man), approximately 1,400 Washingtonians had signed up and registered in the Patient Database Registry Self-Incrimination System. Let’s assume they hit 1,500 sick folk by weeks’ end … that implies that 0.028% of the 5.3 million Washingtonians over the age of 21 are now, officially, Patients. It would be a smaller percent if one were to take the 18+ year-olds into account. I did not bother to check if any of the 1,400 were 18-21-year-old “tweens”, but I gather somewhere just shy of 100 of the registrants are “designated providers”, which likely represents someone caring for either a child or for a Patient unable to make it to the appropriate storefront cum dispensary.
In any case, we appear from these numbers to be a surprisingly healthy State. The DOH and the WSLCB (let alone BOTEC and the UW) must just be patting themselves on the back right now. Looks like 342 square feet might just supply the medical market after all, eh? All is looking good, Governor Jay …. all is looking good ….
Sarcastic bullshit aside, I am a firm believer that decisions should, when possible, be as well-informed as is feasible. In that spirit, I thought I’d do something to help those new to WA’s non-donation-based dispensary system. This post may also address some recent commentary and questions that went up on 502Cannabis regarding why State-legal Cannabis costs what it does and which of the folks involved in getting those millions of grams of bud out to WA adults is most benefitting from the dollars being paid by consumers for that very bud (see, Frank … I’m paying attention … the 60BC’ers will be seeing a lot more of this than will most people).
I’ve heard a number of people in the industry that I generally assume to be well-informed repeat the soundbite that “the consumer dollar is split roughly evenly between the Retailer, the Farmer and the Tax Man“. I thought I’d look into that assertion and share some of the results of my work with those of you learning your way in the new market. As it turns out, they were wrong (on average).
Two things are included here for you today – an overview chart showing a theoretical example where the Retailer “makes” $10.00 from you for a gram (and the tax-man makes $3.70). That chart uses the often maligned pie to convey the relative split of the $13.70 you, the Patient, would part with for this theoretical now-medical-because-it-is-labelled-as-such gram. After some verbiage from me, I then include a table that includes some numbers using a fixed price for the farmers and some different out-the-door prices for Patients, that shows you some more real-world pricing examples for your cost.
As will usually be the case in these non-commercial (public) glimpses into the tools I’ve developed to support my consulting practice, I’m not going to share too much of the specifics of my methods and/or metric definitions. Comments on HI-Blog can be used to address any questions that arise (if you have some, you are probably not the only one … I know how my early-morning weekend writing can get). Seriously — ask … .and challenge me if you see anything that looks ignorant/wrong … it might well be ignorant and/or wrong and I would love your feedback …. it truly helps to make what I’m creating better. I don’t like being wrong, but I hate bad work of mine misinforming others (and me) … and that is what bad work left unchallenged tends to do.
As a side note: This is likely why I’m disappointed with the University of Washington Cannabis Law & Policy Project’s position regarding the recent student project they submitted that used BOTEC’s flawed methodology.
My disappointment increasingly extends to the WSLCB for calling the work-product of the UW’s doomed effort “research” and highlighting it as a resource on their website … but that is for an upcoming post. I know the dedicated public servants down in Olympia are busy keeping us safe from the poisons that are alcohol and nicotine, as well as trying to keep recreaters and Patients safe from the “poison” that they think Cannabis is. I think increasingly that they must not really believe it to be medicine and think, therefore, it should be regulated like the sin-drugs they know and love.
The following chart takes a theoretical gram of flower that a Retailer “makes” $10.00 of gross revenue from (before paying the Farmer and other expenses). As a Patient, you will be charged the excise tax on top of this (at 37%). In Protecting the Patients, our legislators compassionately leveraged their legislative pens in 2SSB-5052 and thereby saved you the State and local sales taxes paid by the recreational portion of the market. As a result, the other 9% or so tax that non-registered-and-non-databased Patients have to pay is not included in the chart or the table below. Everything that follows refers to flower only (buds, joints and cones combined).
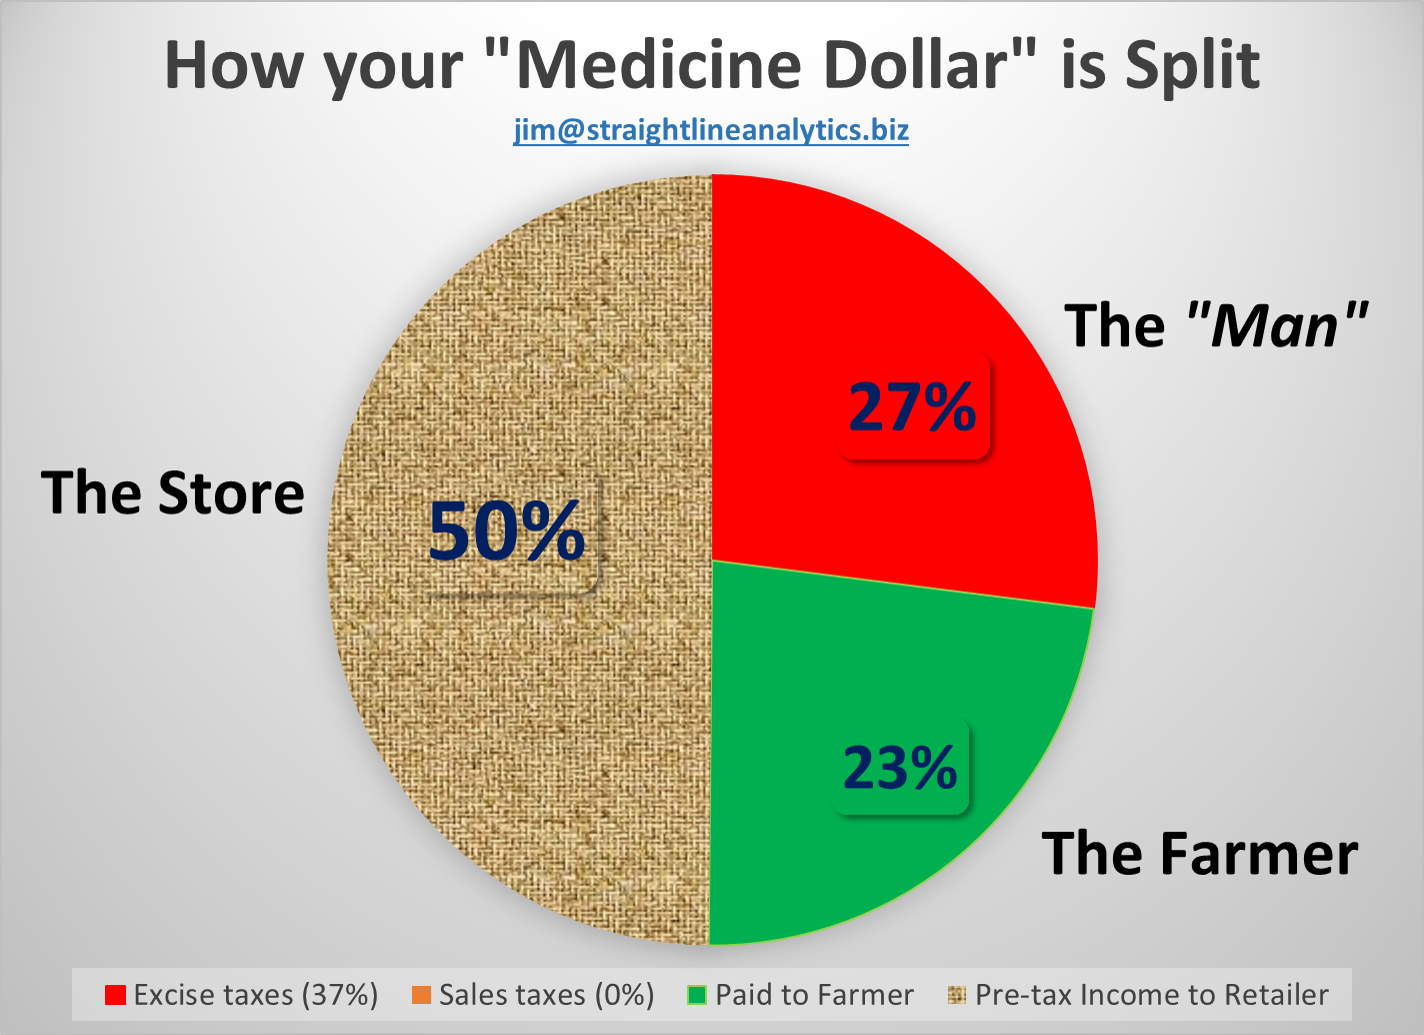
Upon digesting this pie, you may have noticed that your FEES are, on average, differentially grabbed by the Retailer in this market (based on data as it existed in Jan-April, 2016). It is NOT a 33/33/33 split (with 1% apparently left over for me). Forget the whole ethical grand-mal seizure that taxing medicine represents — of what is left, the RETAILER is getting (on average) over 2/3 of your dollars (the only remaining variable here being how much they pay the farmers … I’ve set it at $3.17 per gram in this example).
The Farmers that have nurtured the little ladies (and those males integral to the vibrant genetic base of the industry) along for months and have prepared them for market and have duly labelled them about 3 times more than they should have to are getting less than a quarter out of every dollar you drop in a typical retail store today (today being based on the first 4 months of 2016).
A big thing to note is that Retailers are absolutely smacked by an IRS tax thing meant to collect tax from drug smugglers and pushers and other undesirables. The best way I’ve found to think of it (thanks to Vito and Bob for helping me along with my understanding on this topic) is that pretty much every cost of doing business for a Retailer actually costs them (when tax time is taken into account) about 1.5 times what they pay out-of-pocket for it. For example, that $15.00 per hour position is, actually, a $22.50 per hour position (not including any benefits … which would ALSO cost the Retailer 1.5x what they actually cost).
Given that logic, I believe a 60:40 Retailer:Farmer split of the “Net Revenue to Retailer” (as labeled in the table below) would be about the “right” split. Again … that’s just me, and it’s certainly up for debate. The world does not actually consist of neat averages.
I do sincerely believe that the Farmers could seriously and urgently use a bigger slice of the revenue pie than they are currently getting, but I’ll let better-informed parties argue the point. One thing to remember is that this chart (and the table that follows) show averages and examples based on scenarios that the detailed data suggest are reasonably “typical” and/or “realistic” in the market as it existed earlier this year. Actual prices will be a bit lower (on average) today.
OK: Part 2 of what I promised you today —
Here’s a table that shows examples that are a bit more representative of what you are likely to see out there in the market where the Retailer (for mainly cash-management and consumer-throughput reasons) generally asks for an even dollar amount per gram. The table includes $14.00 per gram, the $13.70 corresponding to the pie chart you just digested, and $12.00 and $9.00 to capture a bit more of the price range that seems to be dominating the State-legal access points these days. In all cases, these are all-in, everthing-included out-the-door prices to the patient-in-the-Registry. Non-Registered Patients and non-Patients would have to figure in sales tax, as well.
(I’ve done that elsewhere, but this is a Patient Service Announcement and your time needs to be focused so that it can deflect the onslaught of the way-too-many words I produce).
The markups and multiples are done the way I always define them. If you have a question on what these mean, take a moment to look at the relative size of the PAID TO FARMER and the PRE-TAX INCOME TO RETAILER values in the table below, as both markup and multiple are derived from those. (e.g., $6.83 is 2.15 TIMES $3.17, and the markup takes out the initial $3.17 and makes it into a percent “growth” (for return-on-invested-capital type assessments). For simplicity, I’ve set the dollars paid to the Farmer per gram at $3.17 …. this falls in the “bulge” of the pricing distribution for the state.
Here is the table:
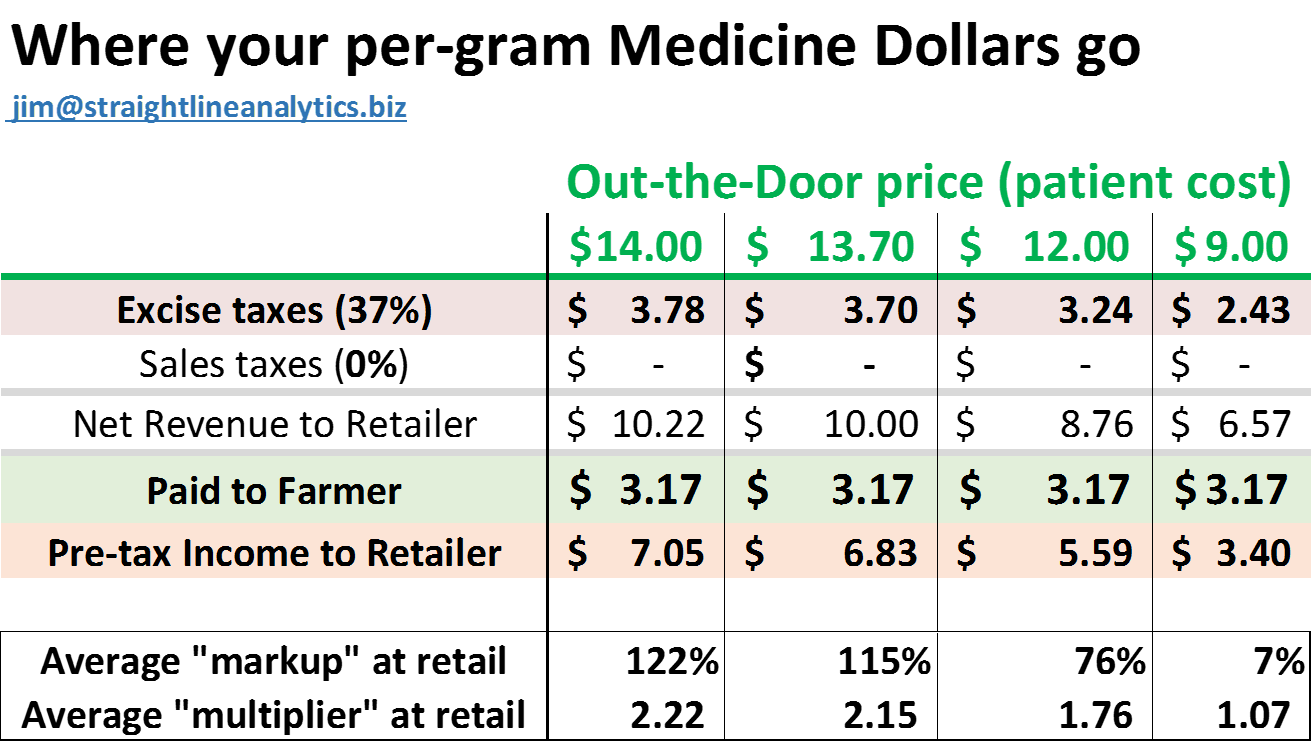
The key thing is that the ratios in these examples are fairly robust estimates of the reality you are about to face (assuming, as the table does, a constant per-gram price to the Farmer that translates into about $1,440 per pound of bud).
Enough of that, for now. I truly hope you found this useful.
Please stay tuned for a listing of the stores in the State that fall at both ends of the distribution of “Markup”, (not as defined above, but defined by how much each Retailer is actually paying for the flower vs. what they are charging for it (in Net Revenue to Retailer terms). I have a full list now, and there were some surprises for me in it … I want to ensure it’s good to go before releasing, as I think I’ll share both ends of the distribution with you.
After all, your medical dollars will not go as far now that The Man insists on taking more than 25 cents of every dollar you spend on the non-FDA-approved medicines that you have come to depend upon. If you have to spend such money, you may want to ask yourself whether you differentially want to help the Farmers that have created this market and that have created the diversity of products you find on the Retailer’s shelves. It is, as I mentioned, a personal choice. I’ll try to help you choose “wisely” (e.g., in a better-informed manner). I, personally, want lots of successful artisan farmers who each raise the bar for the others dynamically and continually, so that they (and we) can dominate this market, nationally (and Internationally) when the times allow. All consumers (even the lovers of Bud-style “bud”) benefit from such a market. Aspiring monopolists, maybe not so much.
As a teaser: my working labels for the two segments of Retailers that will be listed are: TRUMPS and BERNIES (Demons and Angels are my sub-group labels for the most extreme of the extremes).
Guess which group appears to be sharing their wealth to a greater degree (and, thereby, not getting quite as much for themselves) and which group is squeezing their suppliers and/or bleeding their customers more (and, thereby, getting quite a bit more for themselves)?
One last rhetorical question (and no hyphenated word-streams, for a change):
Would the Supreme Court that sits today agree that those State-Legal Cannabis stores falling in the former category are only behaving as modern disenfranchised people can reasonably be expected to do, or would the Court try to enable a legal framework that provides those stores and their controlling entities a valid reason to behave as real people should behave while creating a new medically-impactful marketplace with a reasonable expectation that positive business results might then follow?
I should have a list of top/bottom markup stores out within a day or so (now looking to be Wed, July 20), assuming no cease-and-desist orders crop up in the next 48 hours … keep an eye out at www.highintelligence.org
Let me know what you think of these Patient Service Announcements. I’ve been impressed with the traffic on my site over the past few days … I’d love to hear your feedback, which is best supplied using the comments box at the bottom of my posts.
Jim
Looking forward to your further posts.
Glad to hear it, Dawn.
Thank-you.
I hope you are well.
Question; on the chart you show above there is a row titled net revenue to retailer. Wouldn’t that still be considered part of the gross revenue? The retailer still needs to pay all the other business taxes, overhead expenses and payroll.
Good day, Keith. Yes — what I call “Net Revenue to Retailer” is, by most ways of looking at finance, actually somewhere between Gross Revenue and Net Income.
I call it “Net Revenue” here to emphasize that it is the revenue going to the retailer NET OF EXCISE and/or SALES TAXES.
It is GROSS to the extent that it is all the money the retailer really sees (they see the EXCISE and SALES taxes, but those go poof pretty much right away to the State …. and I pretty much always ignore them when speaking in terms of the businesses.
However, as these PSAs are being written primarily for Patients (and other potential consumers new to the State-legal Cannabis market), I was trying to emphasize TO THEM that what the retailer is getting is not really the $13.70 that the consumer pays, but the $10.00 that the Retailer “NETS” from the consumer. COGS and business expenses and payola and B&O and opportunistic fees levied by opportunistic agencies and, of course, Federal Income taxes all take away from what I called “Net Revenue to Retailers” to yield their true “Net Income”.
I try to define my terms in my posts … or give enough data so that what I’m saying can be parsed by most folks.
Using “Net Revenue” here may not have been my best choice of terms, but I’ll stick with it, as it is, actually Revenue net of something (in this case State excise taxes …. and local & state sales taxes — which don’t really count for patients, thanks to the largesse of our elected leadership.
Thank-you for asking for clarification. I hope it’s more clarified now (like butter?).
Jim
Thank you for clearing that up for me, great work.
Thanks Jim. These are helpful and well-presented numbers.
However, I can’t see any correlation between these gross revenue numbers and ‘good’ or ‘bad’ retailers (I’m inferring this is where you are going). Simply because of two things:
A) Worst-case scenario, knock 50% off of those retailer take-home numbers for federal income taxes and, often, self-employment taxes. Or range it from 35%-50%. It’s impossible to be perfect, and there are other minor deductions for retailers besides wholesale purchases, but 35%-50% from gross profit is within reason.
B) After that deduction, anything left has to pay every other retail operating expense (rent, salaries, utilities, etc.) before the owners get a cut. Unless it’s a corporation where owners take salaries, but I don’t want to complicate this too much. I like your straightforward presentation.
C) As for the producer/processors, we have a lot less visibility as to their tax burden and operating expenses in this model (by necessity, not design). The “magic” of IRC 280E is because it is so restrictive for retailers, you really only need two numbers to estimate their federal taxes – wholesale cost and retail price.
Growers have higher start-up costs, but usually can deduct 90-95% of their total expenses. Very unlike retailers who might be in the 50-60% range.
D) I’m not saying retailers aren’t making most of the profit in this industry – they are. But ideally, I’d like to see not only after-tax estimates of take-home dollars, but also what these businesses are using their profits for. Are they paying living wages or just taking it all to the owners? How much in debt are the owners in that case? Are they spending profits to help the community? Have they made win-win partnerships with lean and profitable growers?
Long-winded way of saying that seeing retailers and growers ranked on their percentage of gross cash at retail is good data, but data that is only the tip of the iceberg. To me, it doesn’t exactly tell me whether or not a business is profitable or failing, whether it is Sanders or Trump. 🙂
Lemme know if I’m being clear or missing anything. Love your posts, BTW.
Thank-you, Todd. You are absolutely correct and I very much appreciate your input.
(addition to my original reply to Todd — I like having editorial control!)
Todd … I re-read your comment and the original post and – based on that – I made a couple of changes to the original post – the main one being at the end where I define the MARKUP I intend to use in identifying some BERNIES and some TRUMPS. My mind was once again running ahead of where my words were. The Markup will be based on the ratios between the dollars the Retailer is paying FOR Flower and the Revenue (Revenue net of Excise and Sales taxes) they are getting for the Flower. Upon reflection, my sloppy use of the words Revenue and Income were probably the culprit. It still won’t take into account the differential Federal tax impact on Retailers or the different costs-of-doing-business of different businesses, but I’m only human. Thanks again.
I’m only taking the fixed things that I have very good data on into account here. I’m TOTALLY ignoring federal taxes and the variable tax-efficiencies that different individual businesses will be able to achieve. I’m also TOTALLY ignoring the different costs of doing business while leasing a storefront in downtown Seattle vs running a business from the retail location one owns in the middle of rural Washington miles and miles and miles away from the nearest alternative access point.
I’ve found over the years that ignoring things that add complexity tends to make things simpler — particularly when the data necessary to get a handle on that complexity are not readily accessible. In doing so, I am fully aware that ignoring relevant things also tends to make the result of one’s work “simpler” (and not always in a good way … see BOTEC’s piece of shit recent work for an example of shit results stemming from a naïve -almost childlike- attempt to simplify a complex dynamic environment).
As I compile my list of the TRUMPs/BERNIEs divide amongst stores, I will be taking the COGS for their flower purchases into account. I’ll also be a bit sensitive to WHERE stores are operating (think a rural vs urban distinction). If I should see a NADER or STALIN or HITLER in the group, I’ll define that group on the fly and call them out as well (but I likely won’t because, as you so correctly point out, I’m not taking all of the relevant information into account here and, while implying that a business is kinda like a “Trump” (or a “Bernie”) may piss someone off, implying they are a “Hitler” better be done with lots of confidence, lest the lawyers get their licks in).
With all that said and done, however, if every store in the State were always paying exactly $3.17 per gram for flower (which they are not), then knowing that one store charges $15.00 out-the-door while another charges $10.00 out-the-door for the same product does, in my humble opinion, supply information that may be of use to Patients (and, possibly, other consumers) in making their purchase decisions.
What I’ll be ranking the stores on is the degree of “markup” they are doing on flower – period. I’ll factor out excise and sales taxes, ‘cuz I have data on those (if I were obsessive, I’d add B&O and whatnot, as they are constants, as well …. but I’m not an accountant and that crap gives me a headache … nothing personal, but taxes —-in general—- tend to give me a headache).
Know that I’ve looked at the data that I do have very very closely. The variability that I’m seeing with respect to “markup’ is frigging amazing. It’s amazing what being the only store for miles and miles can do for one’s pricing model. It is even more amazing that not every store out in the middle of East Ruraltopia has taken the position that clients are creatures worthy of gouging. Further, it is interesting to see how some local stores that have gotten repeated bad raps for their business practices (like paying below minimum wage while incessantly grinding against pinball machines) tend to fall out in the mix.
That is the type of variability that the list I’ll be putting out later today will reveal.
True … it will be incomplete and imperfect.
I expect it will also be useful and informative.
Todd – I VERY much appreciate your sharing the 35-50% range for expected tax impact to the Retailers …. I’ll use that to bound some of my internal modeling going forward. (and just so people know, Todd turned me on to the horrific Federal tax environment that surrounds this industry and took the time way back when to educate me when I expressed an interest … many thanks, Todd).
Perhaps some day, we can work together to get a “true” picture of what tends to happen financially in different types of Canna-businesses. Then, maybe I’ll learn how to pay taxes properly, as well.
Sorry for the late reply – and appreciate the additional insights and info.
Yes, at some point, we should brainstorm about taxes. I’m just now scratching the surface of getting some rough parameters of what is happening (after having gone through 2 years of returns). The tricky part is also that strategies are changing constantly and even small changes to the law (sell socks!) can have a big impact. Particularly with retailers, it often simply comes down to ‘How aggressive do you want to be?’.
Anyhow, looking forward to reading more. Hope you are doing well.
Thank you Jim for continuing to inform and stimulate a better understanding of what is going on out there.
Thanks to Keith and Todd for adding more perspective and helping clarify how to think about the numbers.
280E and related structural challenges to running a normal business make for an overly complex environment with severe potential penalties if the political winds change. That kind of uncertainty plays into the advice retailers get and the choices they ultimately make with regards to markup and pricing. I’d wager that is one of the primary influences on the wide variability seen with markup. What one makes of the future, how much to hedge for a ‘just-in-case’ scenario, where the balance of compassion and staying competitive is, what value to offer and how to execute that are all questions that get contemplated regularly. There is great value in seeing how answers to these questions and more show up in the numbers…and it is an unfolding story. I imagine similar numbers could be the result of two completely different approaches (or not) and understanding that better leads patients and the stakeholders to make better choices. One of the many reasons I appreciate the work you do Jim.
Looking forward to more words, numbers, tables, charts, and editorial;)
Thank-you, Aaron.
I agree with what you say and like the way you said it.
There are many narratives that can go along with status as an outlier on either end of any distribution.
The one I like the best goes something like “X’s score on this measure puts them in the 10th percentile, statewide”.
A less value-laden narrative — but one no less valuable to know.
It’s when one confers “superiority” or “inferiority” to one value vs. another that problems can arise (although, I’ll argue ’till the day I die that 3 is bigger than 2 ….. knowing full well that bigger is not, actually, always better).
Thanks again for your kind words and perspective.