In which I ask the question: Is it hard to teach old Friends new tricks? Some observations are made relating to both potency reporting and the choices made by wholesalers shopping for and paying for lab results.
Many product purchase decisions in Washington’s regulated cannabis market are based, in part, on the reported potency associated with the purchased product. Flower reported to have higher levels of THC (and/or CBD) generally is quicker to sell and often does so at higher prices than does flower with lower reported levels. Over time, labs reporting higher than average potency levels have tended to attract a higher proportion of available testing business than have labs reporting lower levels.
This post reveals a relationship between the number of lab tests a wholesaler buys and the average potency that is reported for their products. I propose that one factor that might contribute to this pattern is “lab-shopping” and then describe choices made by the customers of the busiest lab in the state when it was suddenly closed by regulators last summer.
Better Numbers with More Testing
All wholesalers testing flower between June, 2014 and Sept., 2017 were separated into one of 5 groups based on the total number of flower potency tests they had purchased over that period. The following table summarizes key measures for those 5 groups.
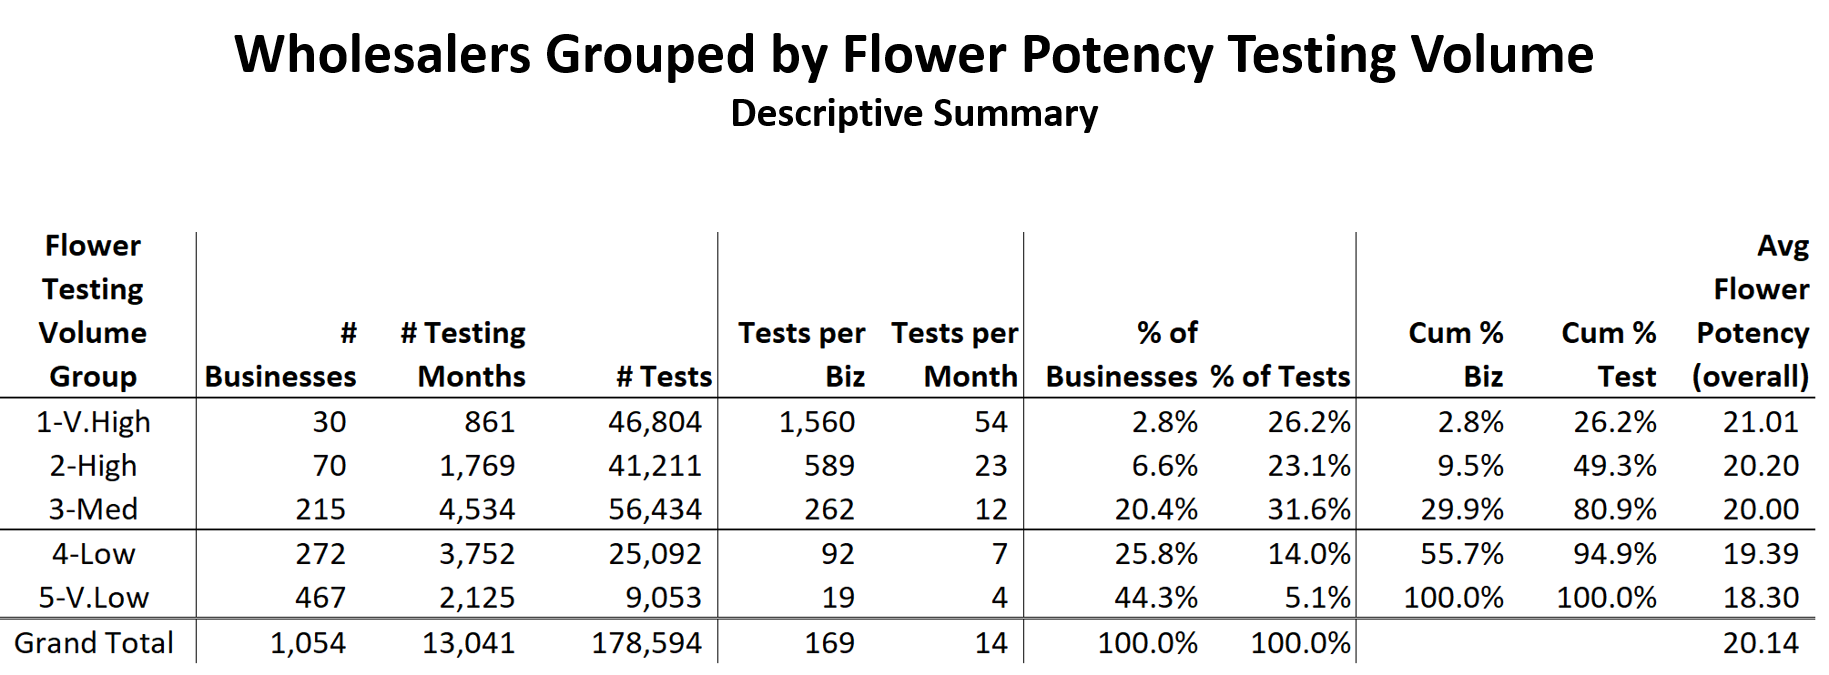
Note the concentration of testing in which the top 9.5% of wholesalers testing flower for potency represented 49.3% of all flower testing. 100 companies paid for almost ½ of the flower testing in the first 40 months of Washington’s market. The other 954 companies paid for the other half.
Note also that the average total potency (THC + CBD, for the most part) achieved by businesses with higher testing volumes tends to be higher than that achieved by businesses with lower testing volumes. Each of these averages is based on thousands of tests. The businesses paying for the highest number of lab tests achieve, on average, reported potency levels 2.71% higher than do those businesses paying for the lowest number of lab tests.
That difference is detailed below by looking at the most recent 12-month trends in average Total Potency levels reported for flower across the 5 testing-volume groups.
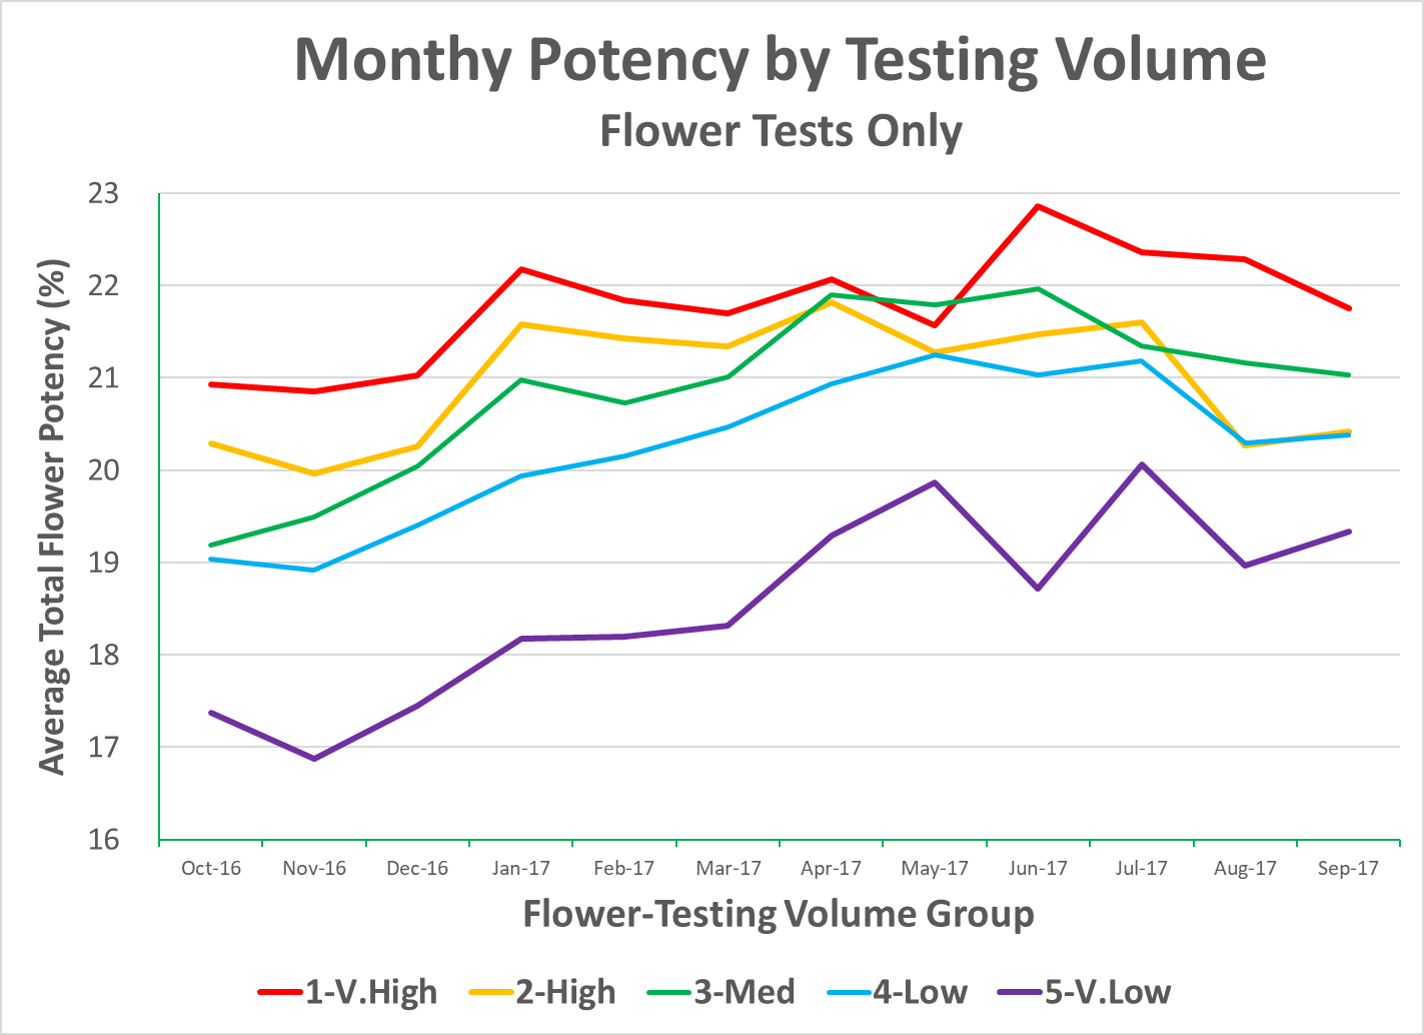
Wholesalers that pay for a high number of potency tests tend to get better results than do those that pay for fewer tests. Given that these groups were created solely based on flower testing volume, it is surprising to see such a regular tendency for potency levels to be higher for those buying more tests and lower for those buying fewer.
Why might this be?
Businesses paying for more tests are likely larger, busier businesses. They have more product to test and, presumably, sell more product than those businesses paying for relatively few tests.
Such businesses may well test more in an effort to improve the results of their growing efforts. These may, differentially, be “scientific” businesses. They measure and they improve results based on those measurements. Then, they measure some more and continue improving.
They may, simply, be empirical in how they run things. Their higher testing volumes may reflect a different philosophy of operating. They may reflect an effort to achieve higher potency levels in everything that they do — and the availability of the capital and cash-flow necessary to make that happen.
It is also possible that some labs may be giving preferential treatment to preferred, high-value (high-testing-volume) customers. If this were the case, the very low average potency numbers reported for businesses testing at very low levels might be indicative of the artificial deflation of potency in non-preferred clients, relative to preferred ones.
Such a mix of higher-than-normal and lower-than-normal values would tend to average out to an average that looked “normal”. Such averages would likely deflect casual efforts to identify inflated potency reporting.
The fact that wholesalers that test infrequently consistently display average potency levels that are 2-4% below those reported for very frequent testers is clear. The fact that those businesses testing infrequently consistently display average potencies notably below all other groups suggests that at least some of the infrequent testers may be the beneficiaries of “unFriendliness” on the part of labs that are, otherwise, trying to be “Friendly” to their most valuable customers.
I have no direct proof of this being the case, but it is curious that the “Very Low” testing volume group (with 467 member businesses) consistently achieves the lowest potency level. This seems odd, in that a disproportionate number of the industry’s “craft” growers likely fall into this group. They may not benefit from the process optimization capabilities of the very high testing businesses, but they should, differentially, benefit from more intimate contact with, knowledge of, and interaction with their plants.
Lab-Shopping
If the differences above are due to high-volume testers being better at using measurement and process optimization to maximize their potency results, one might expect such results to unfold gradually over time as these businesses improve their genetics, growing methods and processing abilities. The bigger businesses have done MORE growing on average (as evidenced by having more tests conducted) and they may have simply gotten better at it than have the “little guys and gals”.
If, however, some labs actually give preferred clients “preferred results” and possibly even compensate for those by giving other clients “non-preferred” results, that would be expected to contribute to higher reported potencies being related to testing volume in a manner such as that which we see.
It is unlikely that labs would advertise that they give higher results selectively to some customers. It is even more unlikely, I’d imagine, that they would advertise that they give lower results to other customers, thereby keeping their overall averages within acceptable ranges, Given this, I became curious about how wholesale businesses might come to know which labs, if any, might be more likely to deliver superior potencies.
I have looked at this question extensively and have repeatedly observed a pattern of lab utilization on the part of some wholesalers that I have come to call “lab-shopping”. Lab-shopping occurs when a given wholesaler displays a pattern of lab choices across time in which a given lab is preferred (sometimes exclusively) for a period of months, followed by a sudden change in preference in favor of a different lab. It turns out that many such changes in preference are immediately preceded by a month (or two) in which the wholesaler sends out samples to multiple labs for testing. Often (not always, but often), the lab reporting the highest average potency in the “lab shopping” month “wins” all or most of that wholesaler’s business until the next “lab shopping” month occurs. The self-reinforcing aspect of this relationship is clear: labs delivering higher numbers will tend to get more business, and those bringing such labs more business will tend to get higher numbers. A lab executive recently described Washington’s lab market to me as a “lie or die” environment.
The disturbing thing, having looked at the temporal patterns of lab choice for quite a few wholesalers, is that when lab-shopping results in a clear “winner”, the reported potencies often suddenly jump up multiple percentage points. This implies that the gains seen from “lab-shopping” are less attributable to incremental improvements in the processes of the grower/processor and more attributable to the variation inherent in the reporting of the winning lab.
The following is a matrix showing the flower potency results for a given wholesaler across multiple labs by month. Months flow from oldest to newest (top to bottom) and average flower potencies reported by each lab are in different columns. If there is no average for a lab in a given month, the wholesaler did not have any samples tested by that lab during that month.
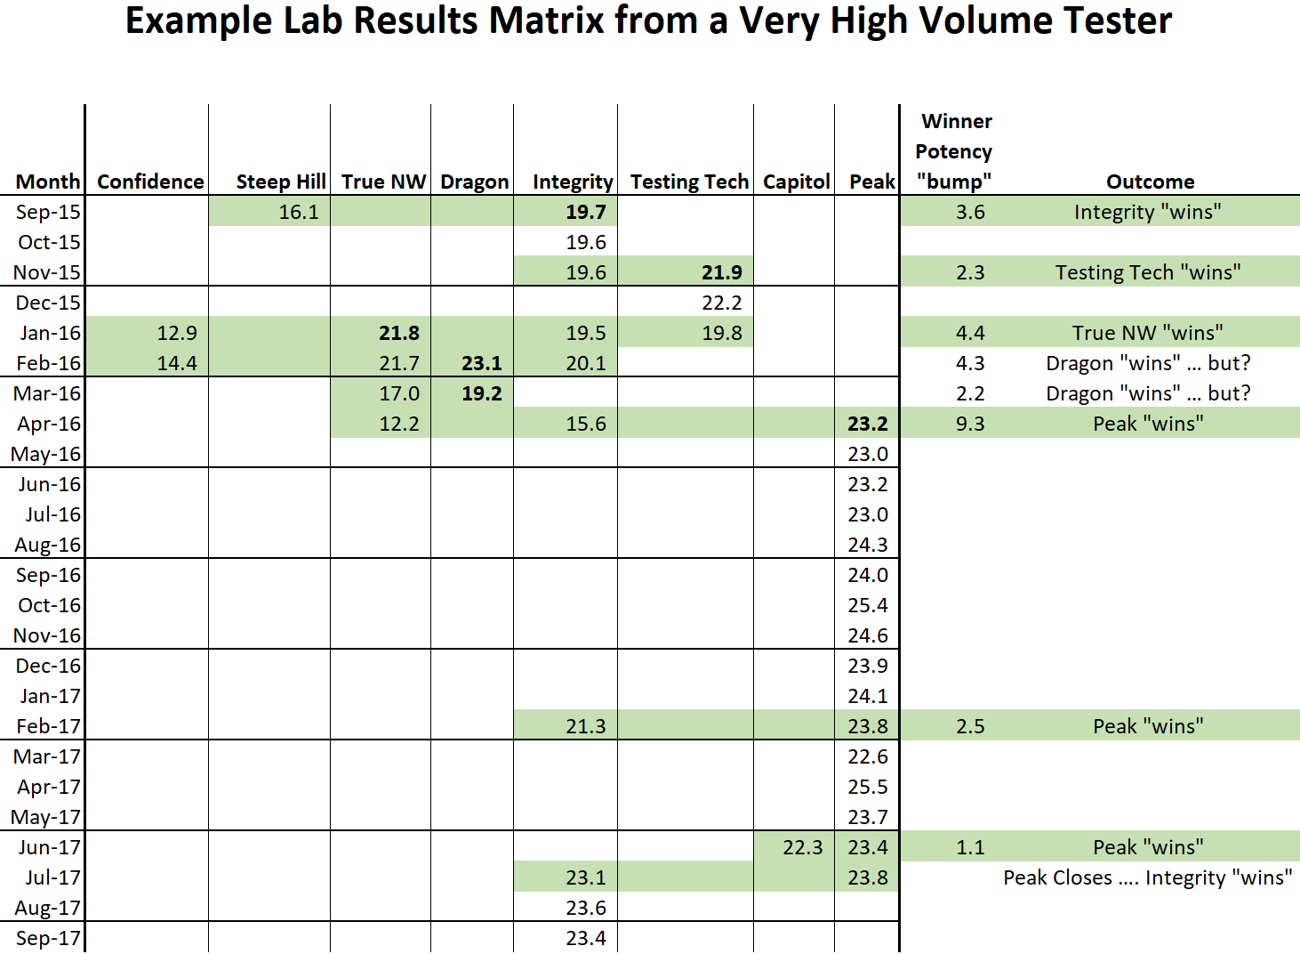
This chart shows the data from one of the members of the “Very High” testing group and provides a clear example, IMO, of lab shopping behavior, I have used green shading to highlight months in which multiple labs were used by that business to test flower. The last two columns give the incremental potency reported by the “winning lab” and the apparent outcome of the “test”. Green shading in the last two columns indicates that I have flagged this month as an example of lab-shopping behavior on the part of the wholesaler that resulted in the lab reporting the highest results winning subsequent business from that wholesaler.
One of the primary things to note here is that the “bumps” associated with lab-shopping average 3.7% (range 1.1% – 9.3%) for this wholesaler.
The difference in reported results during April 2016 are particularly large, at 9.3%. That “win” was followed by 16 months during which the winning lab received the vast majority of this wholesaler’s flower tests. The shift away from this lab that began in July 2017 corresponded to the suspension of that lab’s certificate by the LCB.
I have developed a set of metrics that shed light on each wholesaler regarding the degree to which they seem to be engaged in “lab-shopping”. Please understand that I am making no judgement regarding “lab-shopping”. I am neither for nor against the practice. If anything, I tend to be an empiricist. I LIKE measurement. I LIKE process optimization. I LIKE success.
I also like to be aware of which businesses providing product to Washington consumers appear to be engaged in the practice of lab-shopping.
I also have learned that over half of the wholesalers in Washington show virtually no signs of being engaged in the practice of lab-shopping.
The lab that a wholesaler chooses should not ever be a primary driver of the potency level that wholesaler can report on their product labels. Washington is, today, a state in need of effective lab oversight that ensures improved consistency in reporting across labs. Current controls are not working. Today potency is, in part, being bought and paid for.
PEAK Shift
Since PEAK was suspended last July, each wholesaler using PEAK for testing had to find another lab. No-one received advance notice of PEAK’s closure. PEAK just stopped testing samples one day late in July. Given the prevalence of “lab-shopping”, I wondered if prior knowledge gained from comparing lab results might be used by PEAK’s loyalists to help them choose which labs to use going forward.
The following summarizes the lab choices made (during Aug and Sept) for all wholesalers that had 100% of their flower tests during the months of May and June tested by PEAK. It is important to note that, in response to a number of complaints, the auditors that recommended the suspension of PEAK’s certification explicitly examined PEAK’s potency reporting using data from the first three months of 2017. The auditors reported finding no evidence of potency inflation by PEAK.
The following table summarizes data for the 7 labs that gained the highest proportion of “PEAK Loyalist” testing during Aug and Sept relative to that expected based on their baseline shares.
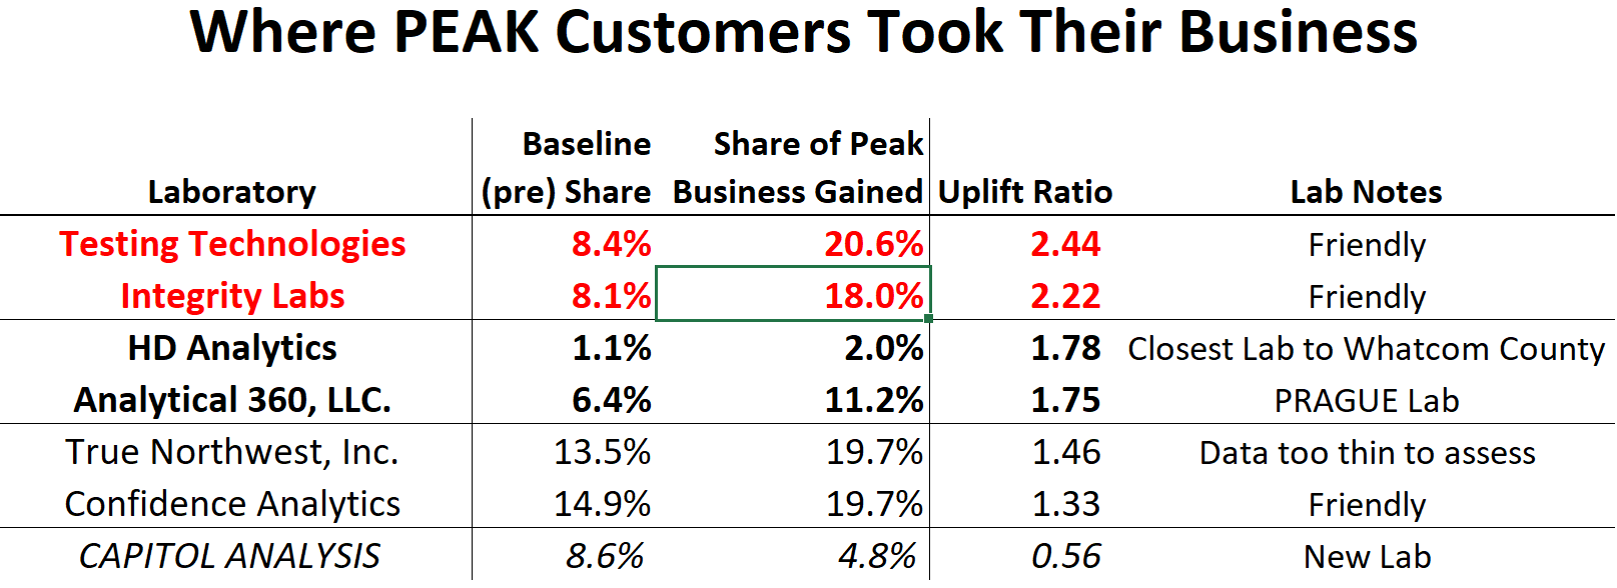
Both Testing Technologies and Integrity labs gained over twice as much of the PEAK Loyalist business as was expected. Conversely, Capitol Analysis gained only about 56% of their expected share of the PEAK Loyalist business
Three of these 7 labs are labs that I previously categorized as being “Friendly” to their customers. One was categorized as PRAGUE (Proficient, Reliable, Accurate, Good, Unbiased and Empirical), and the other three had too little data at the time to be adequately categorized. I find it curious that two of the “Friendlies” top this list in terms of the degree of preference that PEAK loyalists displayed for them when forced to test elsewhere.
The following chart compares the flower potency results reported for PEAK Loyalists by each of these 7 labs in the two full months following PEAK’s suspension beside the results reported for PEAK during the two full months prior to their suspension. This is a “violin” chart, created using the newest version of Statgraphics’ wonderful Centurion statistical software (V.18). It is effectively a grouped box-whisker plot in which the shape of the underlying data distribution is non-parametrically estimated and displayed as a symmetrical density function surrounding each box-whisker. Wider sections of the “violins” represent areas where the density of observations is greater. Conversely, there are fewer observations where the violins are narrow.
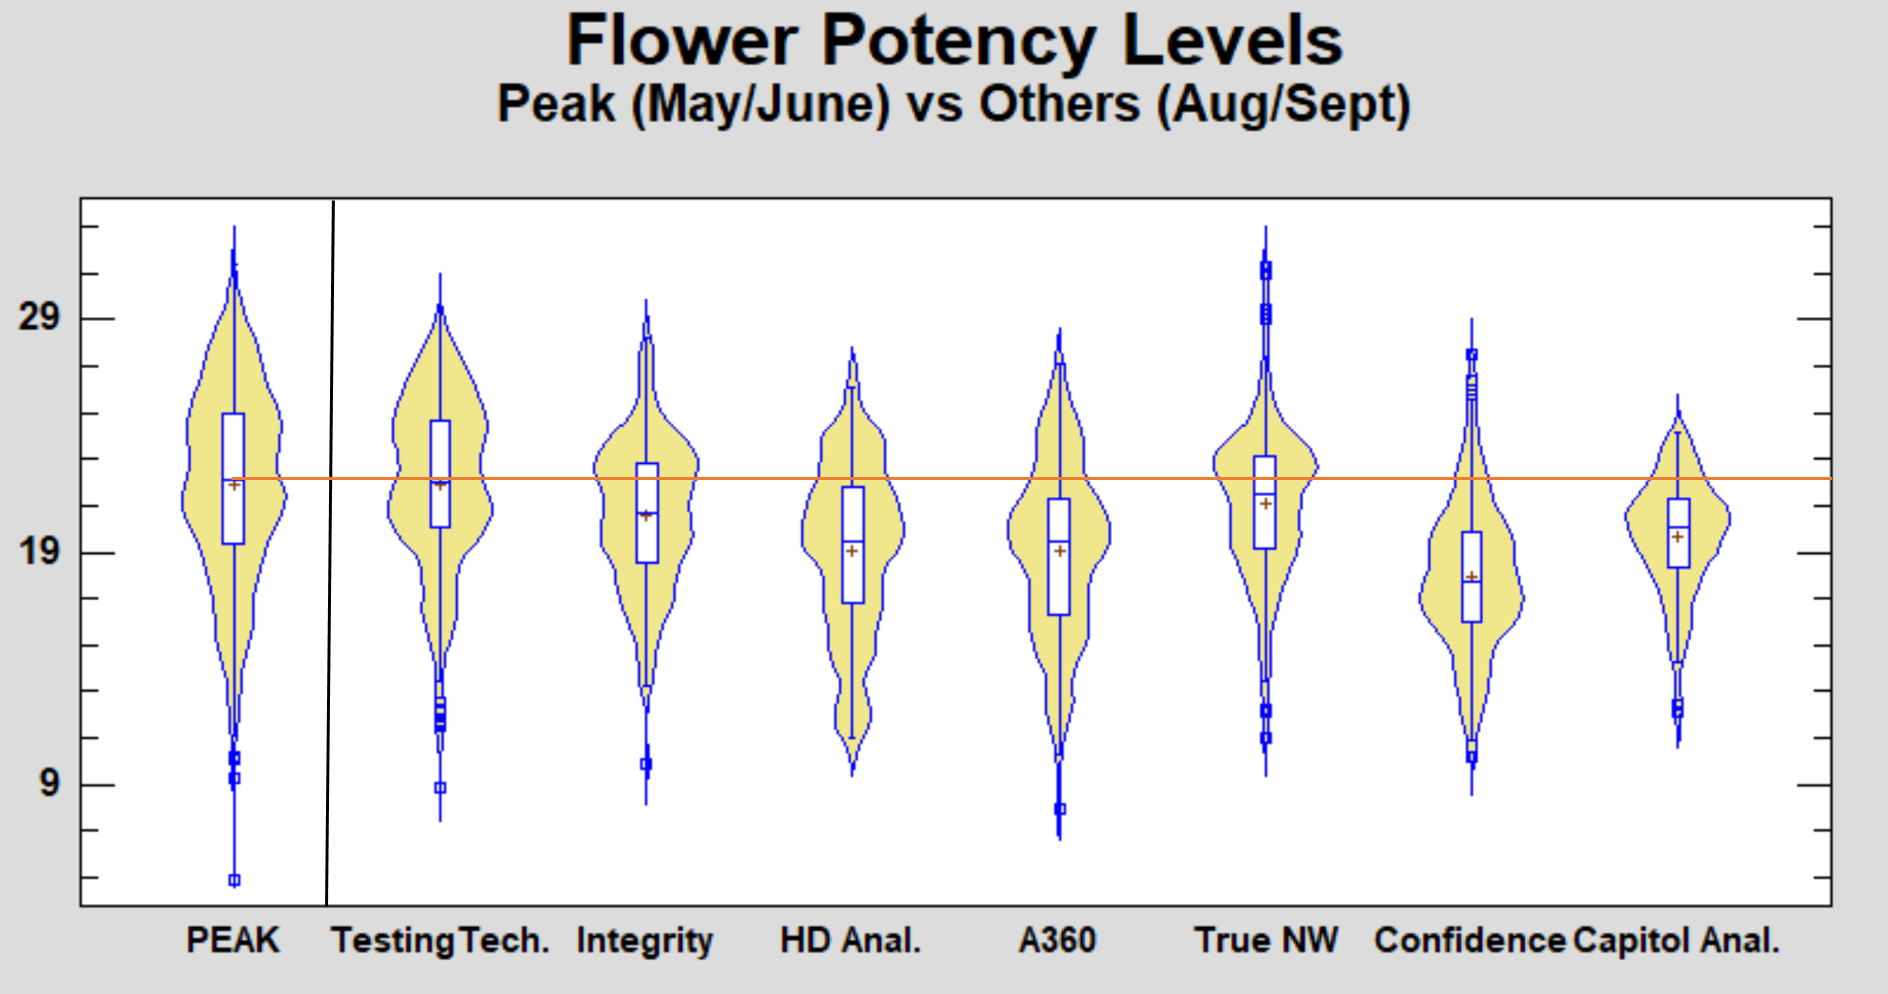
To the right of PEAK, labs are sorted left-to-right in declining order of how much better they did than expected in gaining PEAK’s lost business. Basically, PEAK Loyalist customers tended to prefer the labs (on a relative basis) to the left side of the chart. The seven labs covered captured 96% of the previously-PEAK business coming from PEAK loyalists. The seven labs not reported here shared the remaining 4% of that business amongst themselves.
Each violin contains a box that shows the range in potencies reported for the middle 50% of tests for that lab. The whiskers (lines) extending up and down from the box show the range in which 95% of test results fell. The line in each box is the median and the small cross is the mean of test results.
Note that only one lab (Testing Tech) achieved an average potency level equivalent to that recently enjoyed by the PEAK loyalists.
Note further that only Testing Tech, Integrity and True Northwest have boxes (semi-interquartile ranges) that go above the average potency previously reported by PEAK..
In terms of the shape of the distributions of reported potency, Testing Tech looks very much like PEAK. They each show a clear bi-modality of potencies in which a bulge of higher values and a bulge of lower values both exist.
Integrity and True Northwest are similar, but each display larger “high” bulges than they do “low” bulges. True Northwest also seems to have a large number of both very high and very low outlier values.
Confidence is almost a vertical mirror-image of this, displaying a larger bulge of low potencies than of high potencies. The distribution displayed by Confidence is distinct from that displayed by any of the other labs.
Finally, HD Analytics, Analytical 360 and Capitol Analysis all display distributions that tend to have their primary bulge near the middle of the distribution (note that Capitol’s violin looks almost like a normal distribution on it’s side).
Looking at these curves, I’d guess that the wholesalers that were looking for potency differentially moved to Testing Tech, Integrity, or True Northwest. The wholesalers looking to minimize their drive time from Whatcom and Skagit counties differentially moved to HD Analytics (the northern-most Westside lab aside from PEAK). The wholesalers looking for PRAGUE results differentially moved to Analytical 360 and Capitol Analysis. Those wholesalers looking for something completely different differentially moved to Confidence.
What does this mean? It means that the labs appear to continue to be reporting potency differently. There appears to be a lack of consistency across labs. Hence, there is a lack of consistency across product labels.
Effectively, the information conveyed by the product labels is compromised.
Consumer protections are, thusly, compromised and consumer trust is compromised.
This ultimately hurts the regulated market, most of the businesses that comprise it, and the consumers that source their product from it.
Some labs benefit. Some businesses benefit. The unregulated market benefits.
Unfortunately, consumers do not.
In my opinion (broken record that I apparently am), this is unacceptable and more should be expected and required of a regulated market that takes, in taxes, almost one half of every dollar consumers spend within it.
The current system of annually ensuring that labs are proficient when the certifiers are looking over their shoulders and of then allowing labs to largely run free in the “lie or die” testing market until the next scheduled proficiency test is inadequate. The current system inadequately meets consumer needs.
If consumers cannot trust the labels on the product and, hence, the product itself, then what benefit is there for them in the regulated market? Certainly good product selection exists and the warm feelings that come with feeding the taxman are abundant in the regulated market. That there is less likelihood of some legal problems is a definite benefit of the regulated market, but this is offset somewhat by the increased likelihood of such other legal problems as per se DUIs.
Thusfar, Washington has not gotten lab-testing right in a way that supports transparency, consumer protection, consumer safety, or consumer education. That needs to change … and soon.
Until then, remember that if you want lots of potency it is best to test lots of lots even if you do not have lots of lots to test.
Jim,
Very interesting report, I wonder if the variance in flower potency reported between labs would be more or less relevant to consumers and licensees, if specific strains were analyzed in the manner above? I ask as many consumers (medical in particular) have specific needs or desired results that are generally related more or less to strain type, as an example for the purpose of treating epilepsy, Charlotte’s Web. In my opinion, an analysis of wholesale flower testing results by strain type would be providing service or assistance in supporting “transparency, consumer protections, consumer safety or consumer education”.
Thank you for all the work you do,
Strain names have been grossly mis-used for awhile. There is lots of other work that shows this fairly clearly. With that said and done, I ID include strain name in my potency master datafile, so this is do-able.
Any votes (other than for “Charlotte’s Web” for strains worth looking into?
Well; to be equally fair and transparent for both consumers and licensees who properly brought strains into I-502 during the 14 day window, I would vote for an analysis of all strain names in your potency master datafile, but I understand that is probably a huge undertaking for you and LCB might consider it a very low priority to regulate strain name potency or potential for related I-502 seed violations.
Deborah — thanks for your suggestion. Some work has recently been reported done by a Leafly staffer and a student at Harvard relating to strain names and differences across labs in how potency is reported by strain. Unfortunately that work focuses on two labs that history has taught me should have their data used with great care.
On what I view as a bit of a tragic note, One part of that analysis grouped together data from the two labs that I highlighted in this post and then ran some trend comparisons on the grouped data. Not to get technical, but that suggests that some caution should be exercised when assessing what those authors report.
Jim,
This is a great piece! When we were an operational tier 1 grow we wondered if we might be receiving low results intentionally for this very reason. Despite ever increasing plant health, growing skill continually bringing in potent strains to make stores/consumers happy, we continually saw inexplicable drops in potency testing on a regular basis. Often or strain that would come back with the highest results would not be the one expected or had done so before. We wondered if labs would take low test results from more profitable clients and swap them for the results of smaller clients, in order to make the larger clients happy. I have spoke with other small grows who experienced the same thing and felt this might also be the case.
One could argue that some of the smaller more skilled growers who can give hands on treatment to each plant, should be more likely the ones with the potent plants.
Thanks again for the great work and I will point folks to this post,
Bjorn
Does not surprise me in the slightest that the “craft” growers fall into the low potency category and I’m happy to see it.